Cars are an essential component of the daily life of many people living in the United States. With cities becoming constantly larger and more difficult to navigate on foot or bicycle, people rely on cars to get to work, shop for essentials, and accomplish day-to-day tasks. With an increasing number of drivers on the road every year, even the most cautious motorists run the risk of getting into a traffic collision. In today’s article, we look at New Jersey Department of Transportation statistics on fatal crashes in the state to assess how safe the area is for drivers.
Fatal Crash Statistics by New Jersey County
Throughout 2020, there were 550 accidents resulting in at least one fatality in New Jersey. To better understand where most lethal crashes were concentrated geographically, we created a table tracking the number of fatal crashes, number of victims, and types of victims by county. Of note:
- Middlesex County led all counties in every crash category except for “number of passengers killed,” where the area tied for the highest number of fatalities.
- Sussex (7), Cape May (8), and Salem (11) had the fewest lethal collisions during the year.
- 59% of New Jersey counties did not have any bicycle-related fatalities during 2020.
| Crashes | Killed | Drivers Killed | Passengers Killed | Pedestrians Killed | Cyclists Killed | |
| Atlantic | 38 | 40 | 26 | 5 | 9 | 0 |
| Bergen | 38 | 43 | 14 | 9 | 20 | 0 |
| Burlington | 40 | 42 | 26 | 4 | 9 | 3 |
| Camden | 36 | 38 | 19 | 5 | 13 | 1 |
| Cape May | 8 | 9 | 5 | 0 | 3 | 1 |
| Cumberland | 22 | 24 | 14 | 5 | 5 | 0 |
| Essex | 39 | 45 | 16 | 12 | 14 | 3 |
| Gloucester | 33 | 35 | 21 | 5 | 7 | 2 |
| Hudson | 24 | 24 | 11 | 1 | 11 | 1 |
| Hunterdon | 12 | 12 | 7 | 2 | 3 | 0 |
| Mercer | 20 | 21 | 9 | 5 | 7 | 0 |
| Middlesex | 61 | 67 | 27 | 12 | 23 | 5 |
| Monmouth | 33 | 34 | 23 | 2 | 9 | 0 |
| Morris | 17 | 17 | 8 | 2 | 6 | 1 |
| Ocean | 30 | 30 | 20 | 5 | 4 | 1 |
| Passaic | 26 | 29 | 17 | 5 | 7 | 0 |
| Salem | 11 | 14 | 6 | 5 | 3 | 0 |
| Somerset | 14 | 14 | 7 | 0 | 7 | 0 |
| Sussex | 7 | 7 | 6 | 0 | 1 | 0 |
| Union | 29 | 30 | 13 | 1 | 16 | 0 |
| Warren | 12 | 12 | 9 | 1 | 2 | 0 |
| Totals | 550 | 587 | 304 | 86 | 179 | 18 |
Fatal Crash Statistics by Type of Road
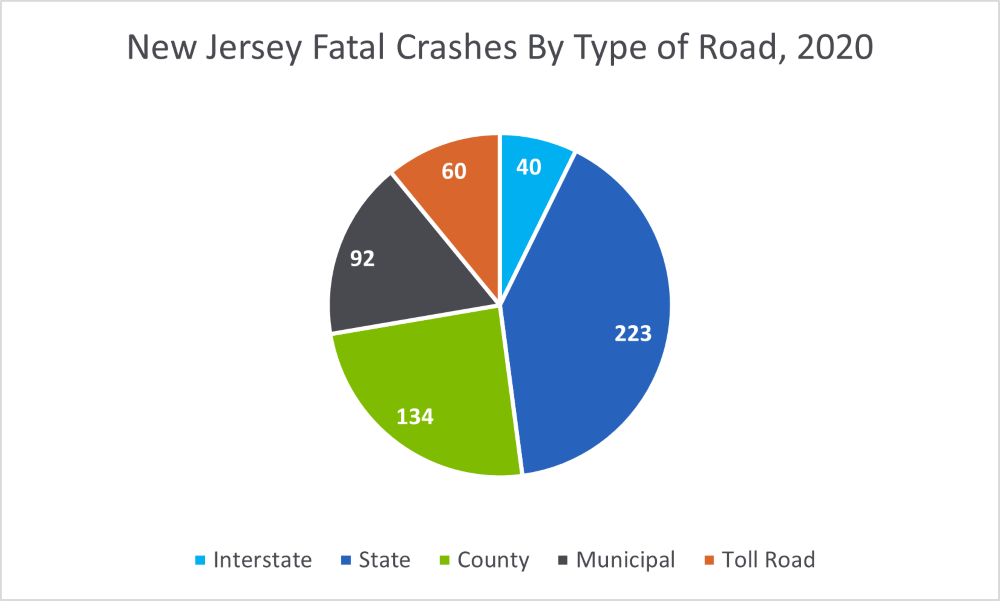
Typically, highways and interstate routes see a higher volume of crashes than rural roads. Highways tend to have higher traffic and drivers are allowed to travel at much faster speeds, which increases both the risk and severity of collisions. The chart below breaks down the proportions of fatal crashes in New Jersey by the type of road they occurred on.
Our takeaways:
- More fatal collisions occurred on state routes (223) than municipal, toll road, and interstate roads combined (192).
- Approximately 52% of lethal collisions occurred on roads classified as “straight and level” and approximately 17% of deadly crashes occurred on roads with any type of curve.
- One crash occurred on a road classified as “other,” which means that the collision happened on a road marked as either a “State, County and Municipal Park” or an “Institution and U.S. Government Property.”
Which Days of the Week Saw the Most Fatal Crashes?
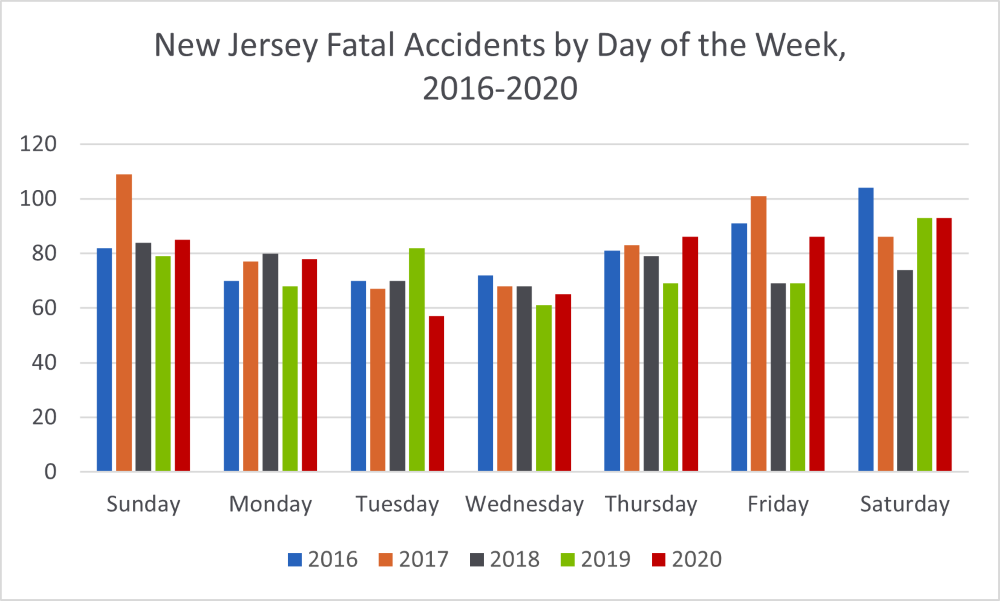
Typically, the weekends see a higher volume of fatal collisions than weekdays. There are more cars on the road and the risk of encountering an impaired driver increases, particularly during the early morning and late evening. We were able to determine which days of the week had the highest number of fatal collisions from 2016 to 2020 and displayed the data in the chart below. Saturday (450), Sunday (439), and Friday (416) had the most crashes over the five years tracked. Wednesday had the fewest incidents, at 334 over the same five years.
Which Months Saw the Most Fatal Crashes?
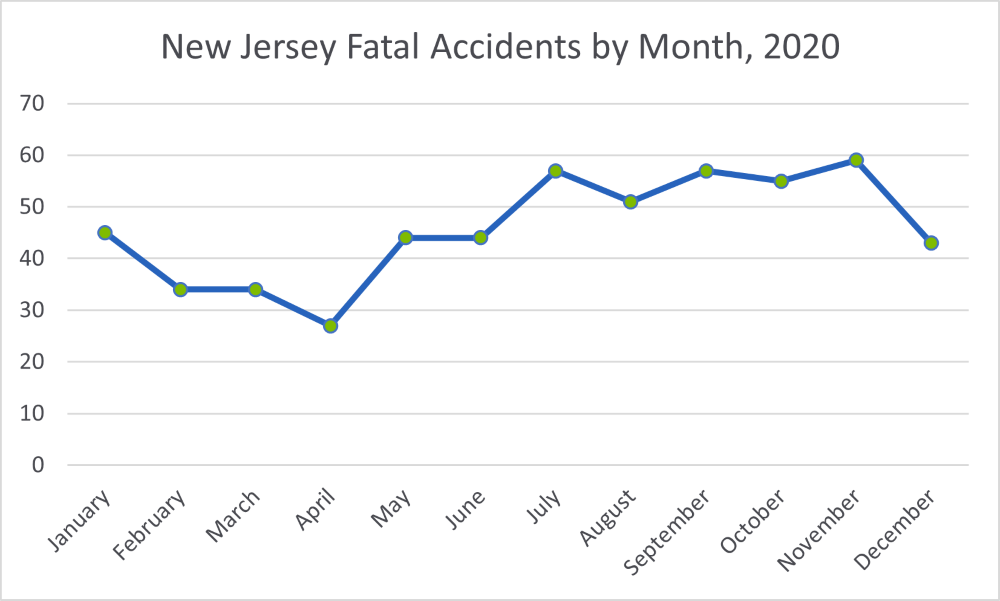
According to the Insurance Institute for Highway Safety (IIHS), the summer months tend to see the highest rate of car crashes. With school programs on summer break, there are more inexperienced teen drivers on the road and families are prone to taking lengthy road trips. Summer is also a popular time for parties, cookouts, and other celebratory events, which can increase the number of impaired drivers on the road. We broke down New Jersey’s fatal car crashes per month in the chart below.
Of note:
- November had the highest number of fatal crashes (59), followed closely by July (57) and September (57).
- April had by far the lowest number of incidents, at 27.
- Spring months had the fewest lethal collisions (105), and summer months had the most (171).
Fatal Truck Accident Statistics in New Jersey
Brady, Brady & Reilly LLC notes that tractor-trailer crashes are likely to cause serious or fatal injuries to those involved in the collision. A commercial truck can legally weigh up to 80,000 pounds in the U.S. when fully loaded, and the forces exerted upon a smaller passenger vehicle in a collision are enormous. Even if a crash victim is fortunate enough to survive a collision with a tractor-trailer, severe injuries to the head, neck, spine, and brain are common.
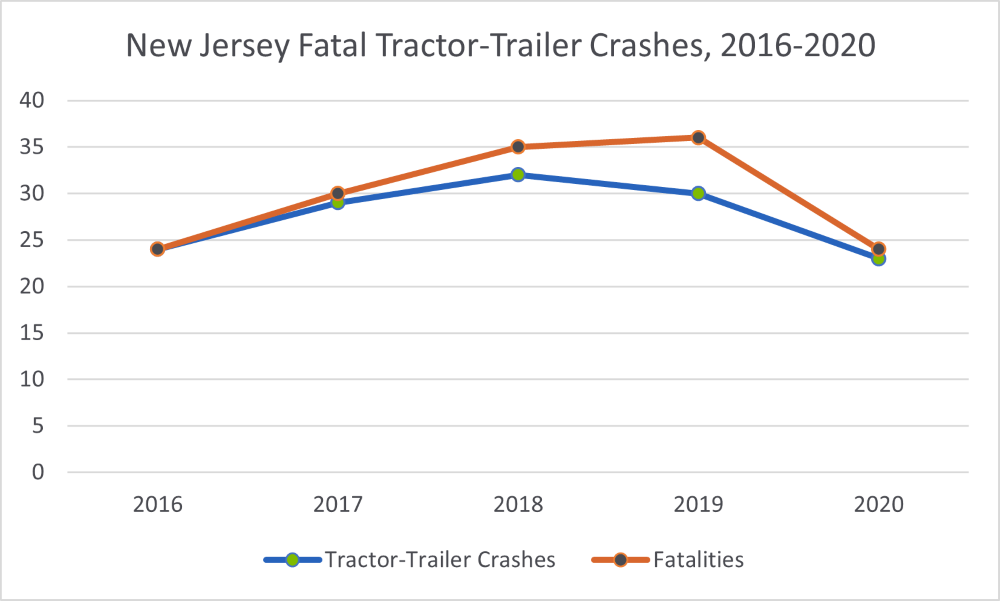
We tracked the number of tractor-trailer lethal crashes and fatalities from 2016 through 2020 in the chart below. Over the first four years, the number of deadly commercial truck crashes increased annually, though fatalities fell slightly from 2018 to 2019. With the onset of the Covid-19 pandemic in 2020, both the number of crashes and lives lost in tractor-trailer accidents dropped, nearly mirroring the recorded figures in 2016.
Intoxicated Drivers Involved in Fatal New Jersey Crashes
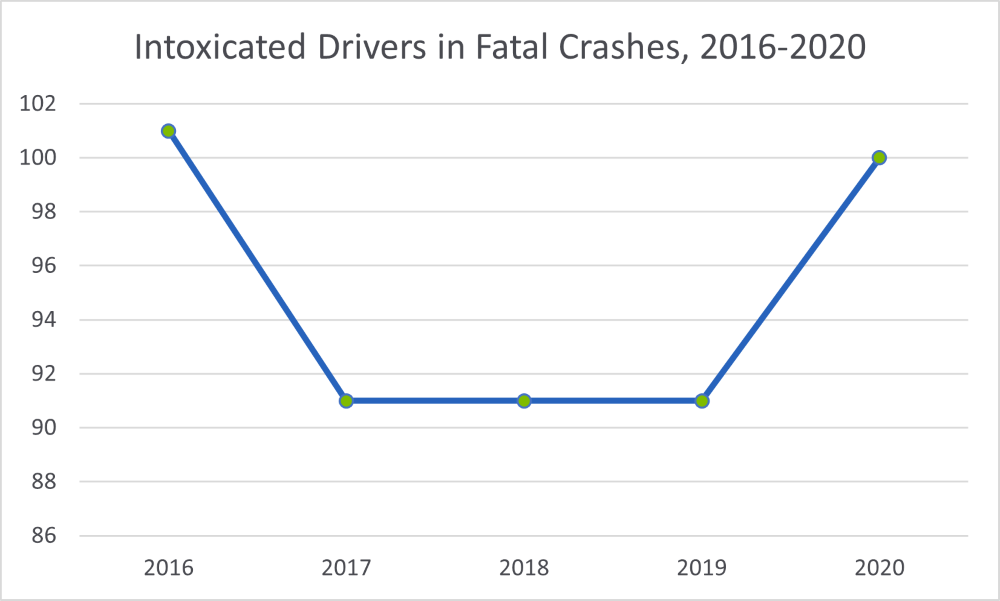
Driving under the influence substantially increases the risk of a fatal car crash. According to the National Highway Traffic Safety Administration, almost 30% of fatal collisions across the U.S. in 2020 involved a drunk driver (blood alcohol concentration of 0.08 or higher). 11,654 victims lost their lives in DUI crashes across the country throughout the year. Looking specifically at crash statistics in New Jersey, we noted that there were 100 intoxicated drivers involved in collisions during 2020. The number of impaired drivers on the road increased in 2020, after remaining steadily at 91 for the previous three years.
Despite the number of drivers on the road decreasing during 2020 with the early onset of the Covid-19 pandemic, traffic fatalities across the country did not drop as steeply as one might expect. Motorists exhibited a higher-than-normal rate of dangerous driving practices, from driving impaired to reckless speeding. While the total number of crashes declined in some states, the severity of collisions generally did not.
Steps to Follow After a Crash
We understand that car crashes are traumatizing and scary ordeals. If you do get into a motor vehicle collision, try to stay calm and follow these steps.
- Check yourself and your passengers for injuries. Call 911 if anyone is hurt.
- Move your vehicle out of traffic (if possible without endangering yourself) and get to safety.
- Call the police. They will take an incident report at the scene of the crash.
- Exchange contact information with the other driver(s) and witnesses and wait for assistance.
- Take down the contact information of any witnesses.
- Speak to a car accident attorney to determine whether you have a legal path to compensation.

Recent Comments